


Summarize Blog
Quick Summary
QA team productivity measures how effectively testing reduces risk and supports reliable releases. Track testing speed alongside coverage, defect effectiveness, automation health, and production quality to avoid rewarding activity alone.
Your QA dashboard shows more tests executed, more cases automated, and more defects reported than last quarter. Yet releases are still delayed, critical issues continue to reach production, and testers spend hours waiting for stable builds. Is the team becoming more productive or simply busier?
This is the problem with measuring QA team productivity through output alone. A higher test count does not show whether the team covered the most important risks. A growing automation suite does not prove that its results are reliable. Even a high pass rate can hide untested requirements and critical user journeys.
Meaningful measurement connects testing speed and effort with software quality. QA leaders need to know how quickly the team provides feedback, what risks it covers, how effectively it detects defects, and whether releases remain stable after deployment. This article explains how to build that balanced measurement system and use connected testing data to make better decisions.
What Does QA Team Productivity Mean?
QA team productivity is the value a testing team delivers relative to the time, effort, and resources it uses. That value is not the number of activities completed. It comes from providing earlier feedback, covering meaningful product risks, detecting important defects, and giving stakeholders reliable information about release readiness.
A productive QA team helps the organization answer five questions:
- Are we testing the requirements and workflows that matter most?
- Are defects being found early enough to fix them?
- Is testing keeping pace with development?
- What remains untested or unresolved?
- Do we have enough evidence to release with confidence?
Several related terms are often used as if they mean the same thing. They do not.
A team can improve test efficiency without improving effectiveness. For example, it may execute regression tests faster but still miss failures in a critical integration. The two dimensions must be evaluated together.
Why Is QA Team Productivity Difficult to Measure?

1. Test Volume Does Not Represent Testing Value
Test cases differ in purpose, complexity, and risk. Executing 100 routine interface checks is not necessarily more valuable than investigating one intermittent payment failure. Test volume can also rise because the repository contains duplicate, outdated, or low-priority cases.
Counts are useful for workload planning, but they need context. QA leaders must also know which requirements, risks, and user journeys those tests cover.
2. Defect Counts Can Be Misleading
More defects may mean the team is testing effectively, but it may also indicate poor build quality. Fewer defects may signal a stable product, or they may mean that testing is too shallow.
Interpret defect counts by severity, component, detection stage, and release. Ten cosmetic issues do not carry the same risk as one authorization or data-loss failure. Defect trends become more useful when they show where problems originate and how many reach customers.
3. Testing Complexity Varies
Routine regression execution, exploratory testing, integration validation, security testing, and performance testing require different levels of effort and judgement. Raw counts ignore that difference.
This is why QA team performance metrics should primarily assess the team and delivery system, not rank individuals. Individual targets based on tests executed or bugs reported encourage people to optimize the number rather than the outcome.
4. QA Outcomes Depend on the Entire Delivery System
Testing speed depends on more than tester effort. Unclear requirements, unstable builds, unavailable environments, missing test data, slow defect fixes, and unreliable CI/CD pipelines can all delay validation.
Separate active testing time from waiting time. If a cycle takes four days but testers spend two days waiting for an environment, asking them to execute faster will not solve the bottleneck.
What Is the Difference Between QA Activity and Productivity?
Activity metrics describe what happened. Productivity metrics help explain whether that work improved testing outcomes.
Activity data is not useless. The mistake is treating it as proof of value. Five hundred completed tests can support a release decision only when teams understand what those tests validated and what risks remain.
How Should Teams Measure QA Productivity Without Compromising Quality?
Use one central principle: Pair every productivity indicator with a software quality guardrail.
Suppose regression validation falls from three days to one. That looks positive until critical coverage also falls and production defects increase. The team has not removed the cost. It has transferred it to support, engineering, and customers.
This balanced approach is consistent, which examines delivery throughput alongside stability. Faster work is valuable only when the resulting changes remain dependable.
Which QA Productivity Metrics Should Teams Track?
1. Test-Cycle Time
Test-cycle time measures the period between a testable build becoming available and the completion of agreed testing activities.
Track active testing and waiting time separately. A rising cycle time may indicate greater test scope, unstable environments, late builds, or slow defect fixes. Pair it with escaped defects and risk coverage to ensure shorter cycles do not result from skipped validation.
2. Test Execution Progress
This metric shows whether planned validation is on schedule.
It is useful during a sprint or release, but 100% execution only means that all planned tests run. It does not prove that the test plan covered every requirement or risk. Review it alongside requirement and critical-workflow coverage.
3. Planned Versus Actual Testing Effort
Effort variance compares the original estimate with the time actually required.
A positive result means testing took longer than estimated. A negative result means it finished sooner. To express the difference as a percentage, use:
Use this trend to improve future planning rather than evaluate the team based on one difficult release. Scope changes, incomplete requirements, new dependencies, and environment failures can all increase testing effort.
4. Test Throughput
Test throughput measures the number of tests completed within a defined period.
For example, if a team completes 400 tests in five working days, its throughput is 80 tests per day. Use this metric only when the tests being compared have similar scope and complexity.
5. Defect Detection Rate
The defect detection rate measures the number of confirmed defects discovered during a defined testing period.
For example, a team that finds 30 confirmed defects during a five-day test cycle has a defect detection rate of six defects per day.
To measure defects relative to the number of tests executed, use:
The team should use the same calculation method across every period being compared. Results should also be segmented by severity, component, release, and test type.
6. Defect Detection Effectiveness
Defect detection effectiveness measures the percentage of known defects found before release.
Post-release defects are also called escaped defects. Segment the result by severity because missing one critical security defect may be more consequential than detecting several minor issues.
7. Defect Retest Turnaround Time
This metric measures the average time between a fix becoming ready for validation and the completion of its retest.
For each defect:
Long turnaround times may indicate incomplete reproduction details, slow handoffs, unstable builds, or limited environment access. Pair this metric with the defect reopen rate to ensure faster retesting does not weaken validation.
8. Blocked Testing Time
Blocked testing time measures how long testing cannot progress because of unavailable builds, environments, datasets, permissions, dependencies, or decisions.
To compare test cycles of different lengths, calculate blocked time as a percentage:
Blocked time is often more useful than tester utilization because it identifies constraints the organization can address.
9. Requirement and Risk Coverage
Coverage can refer to several different areas:
- Requirement coverage shows whether testable requirements have linked tests.
- Functional coverage shows whether product capabilities have been validated.
- Code coverage shows which code was exercised by automated tests.
- Risk coverage shows whether identified product risks have appropriate tests.
- Critical-workflow coverage focuses on high-impact user journeys.
These formulas treat every requirement or risk equally. Teams working on high-risk products should also consider weighted coverage based on priority and potential business impact.
10. Automation Coverage and Health
Automation coverage measures the percentage of suitable tests that have been automated.
The flaky-test rate measures how often automated tests produce inconsistent results without a relevant product change.
Automation maintenance effort shows how much automation time is spent repairing or updating existing tests.
A smaller suite that provides fast, dependable feedback may deliver more value than a large suite that fails unpredictably and requires constant maintenance.

Which Software Quality Metrics Should Guard QA Productivity?
The following software quality metrics show whether faster testing continues to protect the product:
- Escaped defect rate: Defects found after release, segmented by severity and customer impact.
- Defect reopen rate: Issues reopened because the fix was incomplete, unclear, or insufficiently retested.
- Change failure rate: Deployments that require rollback, hotfixes, or other immediate intervention. This reflects the wider delivery system, not QA alone.
- Production incident severity: The impact of failures on availability, revenue, security, compliance, or customer work.
- Customer-reported defects: Issues that reveal gaps between internal testing and real usage.
- Release rework: Effort spent correcting defects or instability introduced by a release.
These are mainly lagging indicators. They validate whether the leading signals used before release, such as coverage and execution progress, produced the expected quality outcome.
How Can Teams Select the Right Testing KPIs?
Begin With a Decision, Not a Dashboard
Start with a question the team needs to answer. “Why is release validation taking longer?” is more useful than “Which 20 metrics can we display?” The question determines the relevant data and the action that could follow.
Select a Small Set of Core Metrics
Most teams need six to eight core testing KPIs, not every available measurement. Add diagnostic metrics temporarily when a core indicator reveals a problem.
These are mainly lagging indicators. They validate whether the leading signals used before release, such as coverage and execution progress, produced the expected quality outcome.
Combine Leading and Lagging Indicators
Leading indicators help teams make decisions during testing. Lagging indicators show whether those decisions were correct.
Establish a Team Baseline
Use several comparable releases or sprints before setting a target. External benchmarks rarely account for your application architecture, regulatory exposure, test scope, or release model.
Segment the Data
Break results down by severity, component, requirement, release, test type, execution method, and risk. An overall defect or coverage number can hide a serious problem concentrated in one module.
Review Trends Instead of Isolated Numbers
One difficult sprint does not establish poor QA performance. Review related metrics over time and document major changes in scope, staffing, environments, and release risk.
Which QA Team Performance Metrics Should You Avoid Using Alone?
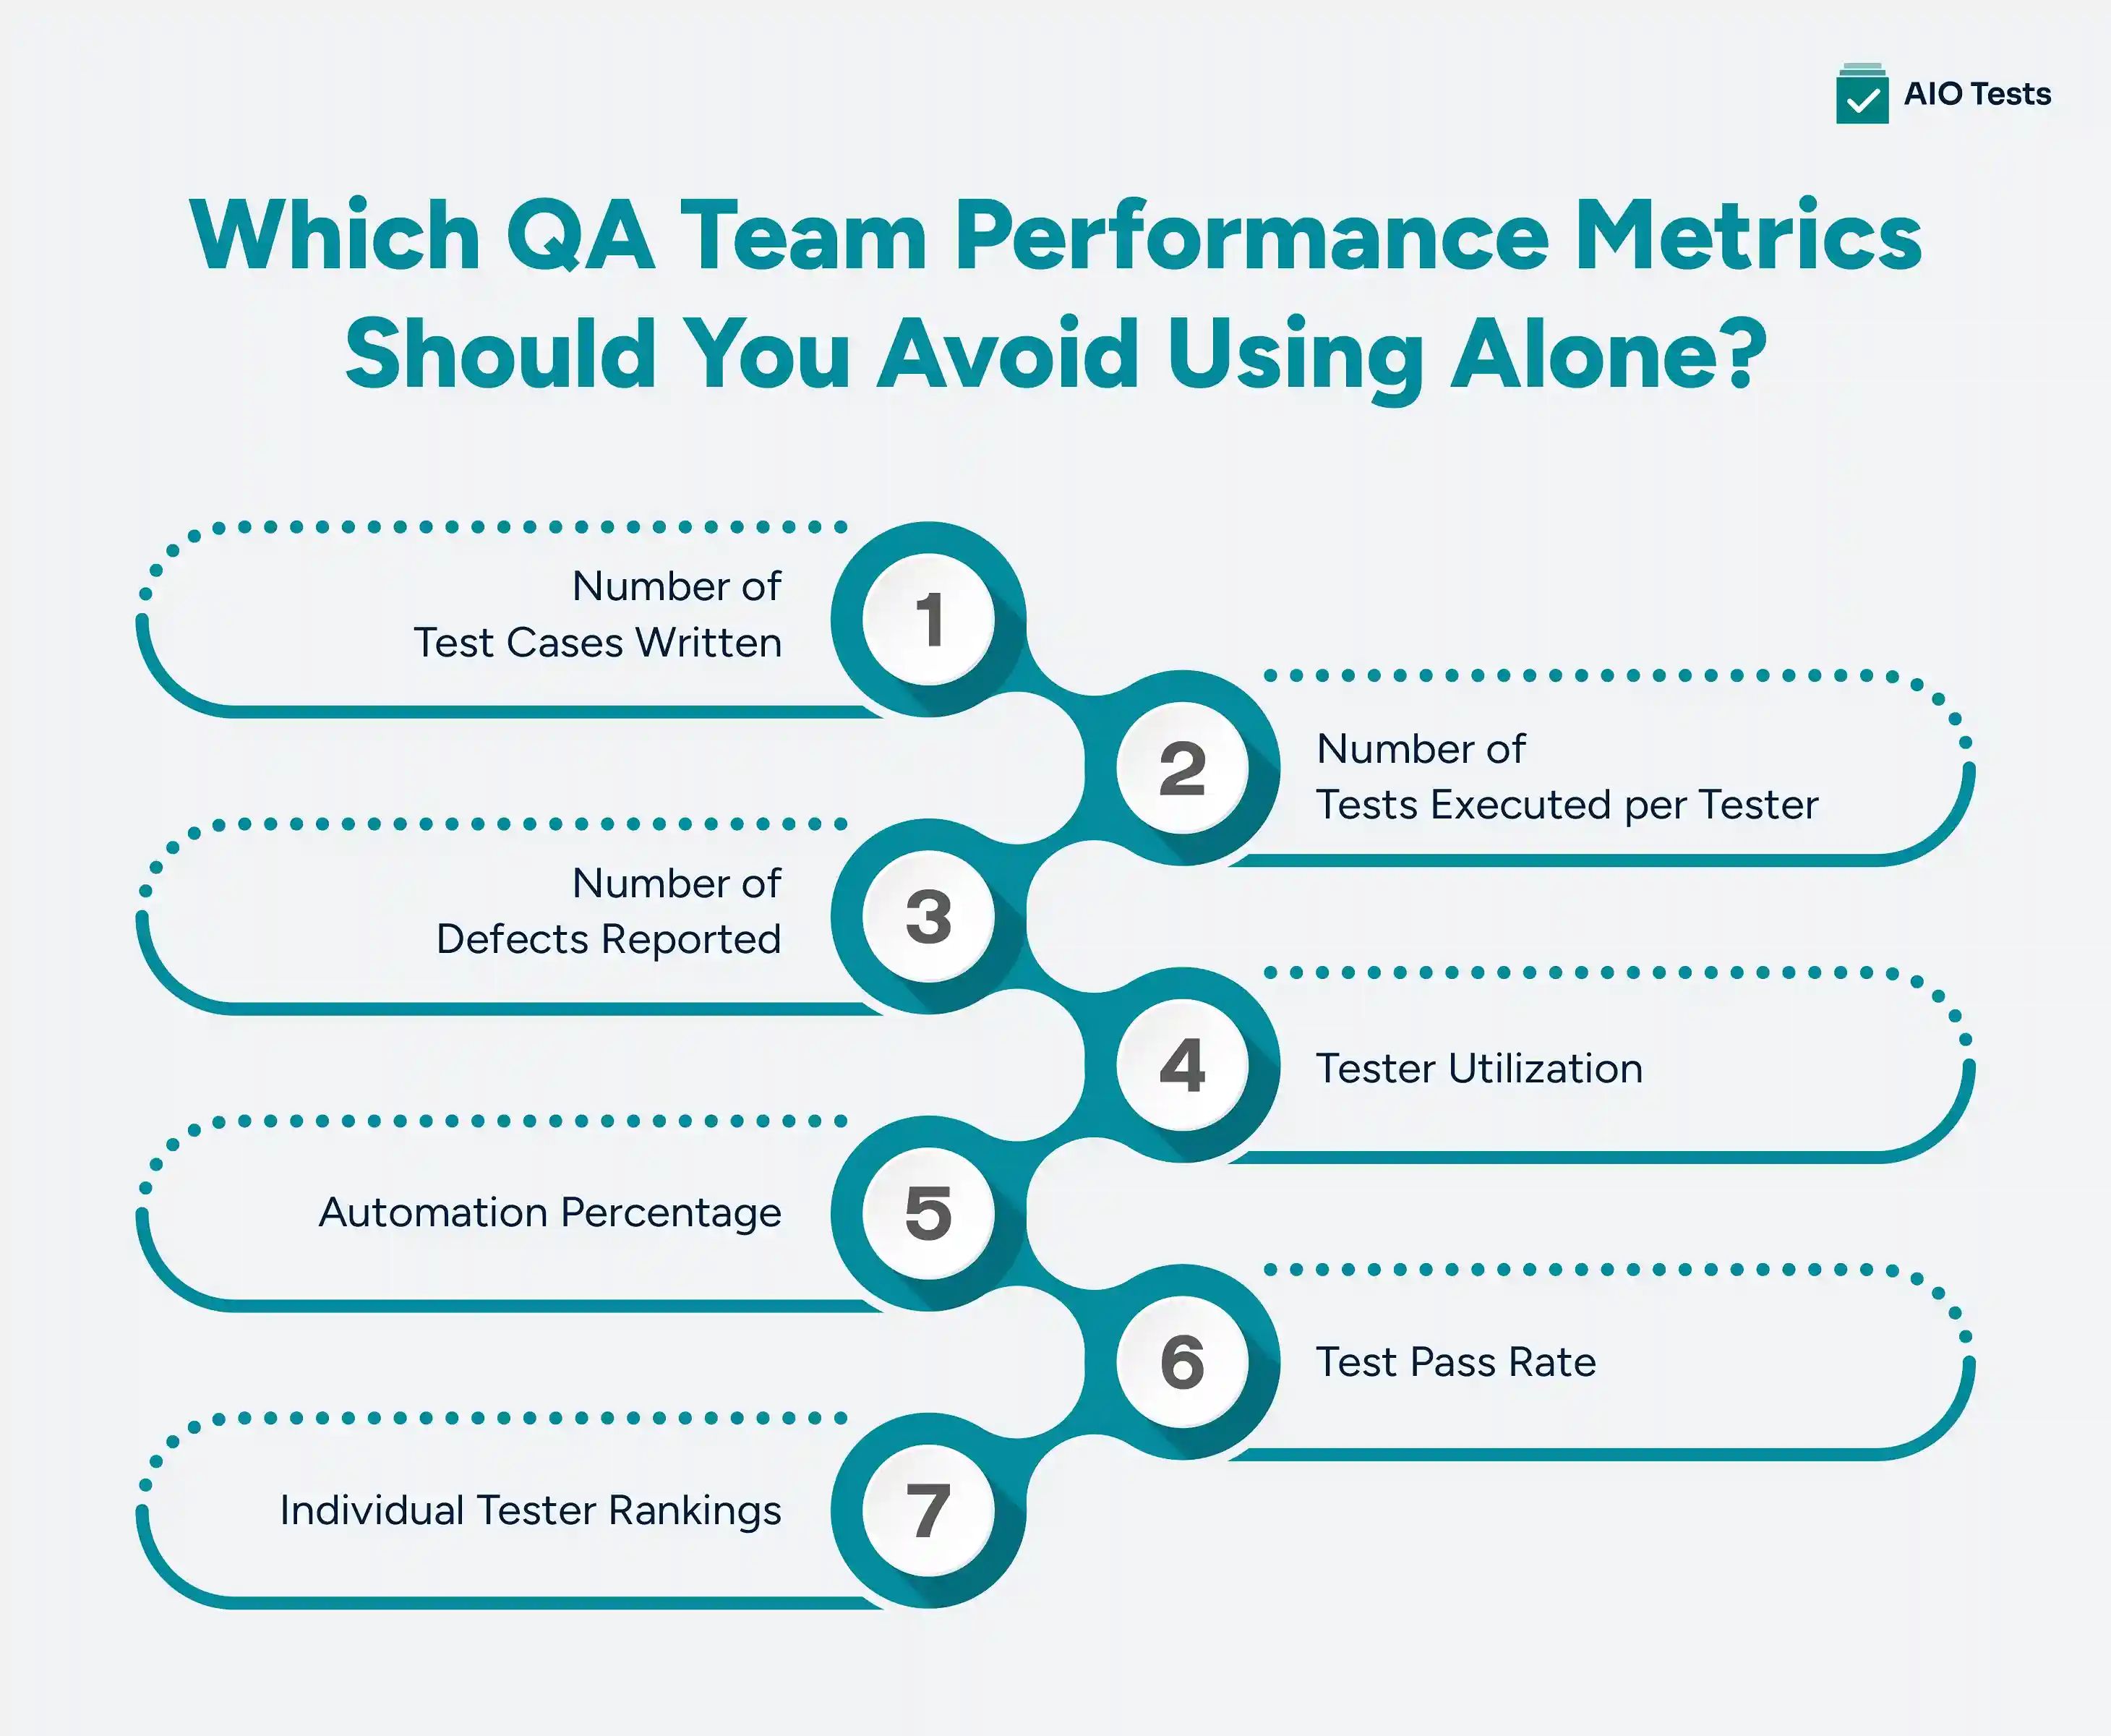
1. Number of Test Cases Written
A test case count can encourage testers to create unnecessary or duplicated cases. It also overlooks the difference between documenting a simple check and designing a complex end-to-end scenario.
2. Number of Tests Executed per Tester
This metric ignores test complexity, investigation, exploratory testing, risk analysis, and collaborative work. Use it to understand workload distribution, not rank team members.
3. Number of Defects Reported
Raw defect counts can reward duplicate, minor, or poorly documented issues. Evaluate defects by severity, validity, detection stage, and business impact.
4. Tester Utilization
Keeping testers constantly occupied does not prove that the testing system is productive. High utilization can create queues, reduce time for investigation, and hide delays caused by environments or builds.
5. Automation Percentage
A high automation percentage does not show whether the tests are stable, maintainable, or focused on important risks. Pair it with automation health and critical-workflow coverage.
6. Test Pass Rate
A high pass rate may indicate a stable build, but it may also reflect weak coverage or outdated tests. Interpret it alongside scope, coverage, severity, and unresolved defects.
7. Individual Tester Rankings
Rankings encourage metric gaming and can weaken collaboration. Use QA performance data to improve team workflows and remove system constraints.
How Does AIO Tests Help Measure QA Team Productivity in Jira?
Productivity becomes difficult to evaluate when Jira requirements, manual tests, automated results, and defects are stored in separate places.
AIO Tests brings these testing signals into a connected Jira-native workflow, helping teams evaluate execution effort alongside coverage, defects, and quality evidence.
Connect Requirements, Tests, Executions, and Defects
This Jira test management tool links Jira requirements with test cases, execution cycles, results, and associated defects. Its traceability and coverage reports help teams identify which requirements have been tested and where coverage gaps remain. This gives test execution numbers the context needed to assess actual progress and release readiness.
Plan and Track Test Execution
QA teams can organize sprint or release validation through execution cycles. The Execution Planner allows teams to set timelines and daily execution targets, while notifications indicate when testing falls behind schedule. A built-in timer records the actual time spent executing manual tests, helping managers compare estimated and actual effort to improve future planning.
Protect Critical Workflows With Reusable Sets
The Jira test management tool allows teams to group recurring cases into reusable Sets for regression, smoke, beta, and critical-workflow testing. These Sets can be added directly to new execution cycles, reducing repeated planning while ensuring important tests remain part of release validation.
Bring Manual and Automated Results Together
The tool can receive automated results from CI/CD pipelines and testing frameworks through native integrations, configurable reporters, and REST APIs. Teams can review manual and automated results within the same test management workflow, providing clearer visibility into execution status and automation coverage.
Monitor Coverage, Progress, and Defect Trends
The test management tool for Jira provides reports covering traceability, requirement coverage, test execution, defects, project health, burndown, burnup, and automation coverage. Jira dashboard gadgets can display execution progress, pass/fail status, traceability, and defect trends. Reports can also be scheduled and exported in PDF or Excel formats for stakeholders.
Reduce Repetitive Test-Management Work
The platform uses generative AI to create classic or BDD-style test cases from Jira requirements for tester review. Linked cases, data-driven testing, bulk updates, and test-case imports help reduce repeated creation and maintenance work. When a test fails, teams can create a Jira defect with relevant test details already included, reducing the need to reconstruct the context manually.
The platform provides connected evidence about testing effort, coverage, execution, automation, and defects. However, customer complaints, production incidents, change failure rates, and other operational outcomes may still need to come from support, monitoring, or delivery systems.
Build a Balanced QA Measurement System
No single metric can define QA productivity. Test-cycle time without escaped defects rewards speed without accountability. Coverage without risk context rewards completeness on paper. Automation percentage without reliability rewards scripts that may not provide useful feedback.
Choose a small set of flow, effort, coverage, effectiveness, and quality metrics. Review them at the team level, investigate the system conditions behind them, and use trends to guide process improvements.
Connected evidence from requirements, tests, executions, and defects makes those conversations more reliable and helps stakeholders make better release decisions.
Conclusion
Productive QA teams do more than execute tests quickly. They focus effort on meaningful risks, detect important defects early, reduce avoidable waiting, and provide clear evidence about release readiness.
Measure activity only as supporting context. Pair every speed or output indicator with a quality guardrail, and validate pre-release signals against production outcomes. This prevents a better-looking dashboard from masking higher customer risk.
AIO Tests helps Jira teams connect test planning, execution effort, requirement coverage, automated results, and defects in one workflow. Book a free demo to see how connected testing data can support clearer QA productivity and release-readiness decisions.

Frequently Asked Questions
1. What Is QA Team Productivity and How Is It Measured?
QA team productivity is the testing value delivered relative to the time, effort, and resources used. Measure it with a combination of cycle time, execution progress, effort variance, risk coverage, defect effectiveness, and post-release quality indicators.
2. Which QA Productivity Metrics Should Teams Track?
Useful QA productivity metrics include test-cycle time, execution progress, planned versus actual effort, blocked time, requirement coverage, defect detection effectiveness, and automation health. Select a small group that answers the team’s most important quality and delivery questions.
3. How Can QA Teams Measure Test Execution Efficiency?
Track cycle time, active execution time, blocked time, test throughput, and effort variance. Review those test execution metrics alongside coverage and escaped defects so a faster cycle does not hide reduced validation.
4. Which QA Performance Metrics Help Evaluate Software Quality?
Requirement and risk coverage, defect detection effectiveness, escaped defects, defect reopen rate, change failure rate, and production incident severity provide useful quality signals. Combine leading indicators from testing with lagging indicators from production.
5. How Can Teams Balance QA Productivity With Software Quality?
Pair every productivity indicator with a quality guardrail. For example, review test-cycle time with escaped defects, automation coverage with flaky-test rate, and execution progress with critical-requirement coverage.
6. What Are the Most Important QA Metrics for Improving Team Performance?
The most useful QA metrics depend on the problem the team needs to solve. A balanced starting set includes test-cycle time, effort variance, execution progress, critical-risk coverage, defect detection effectiveness, escaped defects, automation health, and blocked testing time.


.svg)
