
Summarize Blog
Quick Summary
Learn how to track testing progress with QA Test Case Execution Burndown Reports. Analyze trends, ensure project timelines, and deliver quality results.
A Test Case Execution Burndown Chart helps clear up confusion by showing exactly how many test cases are planned, in progress, or finished each day. It’s a simple visual that keeps QA teams and project managers on the same page and makes it obvious if testing is falling behind.
In Agile teams, where speed and transparency matter, having that kind of insight can save you from scrambling at the last minute. You can spot delays early, shift priorities, and keep the whole team aligned.
Jira makes it easier to track this progress right inside your project board, but getting the setup right can take some effort. In this post, I’ll walk you through how to create and use a test case execution burndown chart in Jira without making things complicated.
What is a QA Test Case Execution Burndown Chart?
A QA Test Case Execution Burndown Report is a visual representation that shows the progress of test case execution over time during a specific testing phase or testing cycle. It helps track the rate at which test cases are being executed and how many test cases are left to complete. This report is widely used in Agile and Scrum methodologies to monitor testing progress and ensure that the testing phase is on track to meet the project's timeline and goals.
The burndown chart typically has the following components:
- X-Axis (Horizontal Axis): It represents the time, usually in days or iterations, during which the test cases are executed.
- Y-Axis (Vertical Axis): It represents the number of test cases that need to be executed.
- Ideal Burndown Line: This is a straight line that connects the starting point (total number of test cases to be executed) with the ending point (zero test cases remaining). It represents the ideal scenario where all test cases are executed at a constant rate and finished by the end of the testing phase.
- Actual Burndown Line: This line shows the actual progress of test case execution over time. It might not follow the ideal burndown line exactly due to various factors like scope changes, or fluctuations in team capacity / productivity.
- Data Points: These are plotted on the chart to represent the actual number of test cases executed at different points in time.
The QA Test Case Execution Burndown Report is updated regularly during the testing phase, like daily or at the end of each iteration. By analyzing the chart, the team can identify if they are ahead or behind schedule and take corrective actions as needed.
How It’s Different from a General Burndown Chart
Interpretation of the Burndown Chart:
- If the actual burndown line is consistently below the ideal burndown line, it indicates that the team is executing test cases faster than anticipated.
- If the actual burndown line is consistently above the ideal burndown line, it suggests that the team is executing test cases slower than planned.
- If the actual burndown line fluctuates around the ideal burndown line, it means the team's progress is relatively consistent with the planned rate of execution.
Using this information, project stakeholders can make informed decisions, adjust testing efforts, allocate additional resources if required, and ensure timely delivery of a high-quality product.
How AIO Tests Support Effective QA Burndown Tracking
AIO Tests is an AI-powered QA testing and test management tool that is fully integrated with Jira. The tool simplifies and optimizes your entire testing lifecycle. Centralizing test management allows teams to test planning, create, execute, and track cases within the same platform they use to manage their software projects.
One of the key functionalities of AIO Tests is the Test Case Execution Burndown Report. This report offers a clear, visual overview of test execution progress during a testing cycle. It helps teams identify if they are on track to complete testing on time or if adjustments are necessary. It effectively supports agile workflows by providing real-time insights into test case status and execution process.
Steps to Generate the Execution Burndown Report in AIO Tests
AIO Tests provides a clear graphical overview of the remaining test cases and the estimated time required to complete them through the Execution Burndown Report. This visual insight helps your entire team stay aligned on testing progress and priorities.
Steps to Generate the Execution Burndown Report:
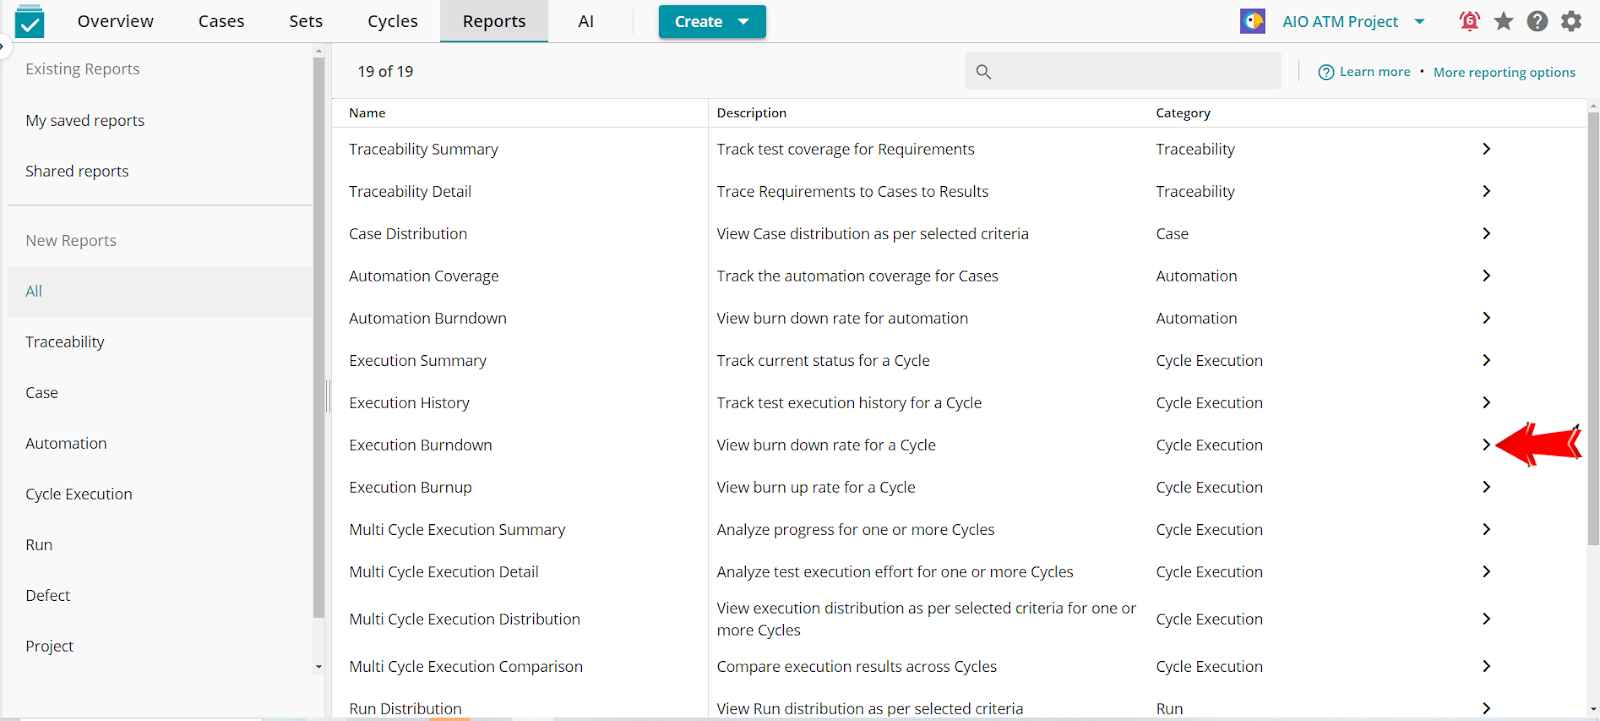
- Step 1: Click the Chevron icon next to the Execution Burndown option.
- Step 2: In the Execution Burndown Report input window that appears, select the relevant test cycle from the Cycle dropdown.

- Step 3: Click the Generate button to create the report.

The generated report will display the progress graph on your screen.

If a plan has not been created for the selected cycle, the graph will show a straight line, indicating that test cases are expected to be executed at a steady pace.

What Else Can You Do with AIO Tests?
Beyond burndown reports, AIO Tests offers comprehensive features, including:
- Centralized Test Management: AIO Tests offers a unified platform within Jira to manage test cases, plans, cycles, and defects. This integration ensures that all testing activities are streamlined, reducing the need to switch between multiple tools and enhancing overall efficiency.
- Complete Cycle Management: The tool allows for the creation and management of test cycles, enabling teams to organize and execute tests effectively. Features like built-in timers help in tracking the actual time spent on each test case, aiding in better resource allocation and planning.
- Reporting and Metrics: AIO Tests provides detailed reports, including execution burndown charts, traceability matrices, and coverage analysis. These insights help teams monitor testing progress, identify issues, and make decisions for timely delivery.
- Automation: The platform supports seamless integration with various automated testing frameworks. Through REST APIs, teams can incorporate automated test results, ensuring a unified view of both manual and automated testing efforts.
- Collaboration: AIO Tests facilitate effective communication among QA teams and developers directly within Jira. Defect logging and commenting enhance collaboration, ensuring that issues are resolved as soon as possible.
- AI Capabilities: AIO Tests assist in generating test cases, accelerating the test design process. This capability not only saves time but also enhances the quality and coverage of tests.
Conclusion
QA test case execution burndown charts give teams a clear, day-by-day view of how testing is progressing. Instead of relying on guesswork or scattered updates, teams can instantly see how many test cases are left, whether things are moving as planned, and where attention is needed. It’s a practical way to stay on top of the testing workload and avoid last-minute pressure.
When used consistently, these charts improve communication across the team, help manage time better, and ensure that testing stays aligned with the project timeline. Whether you're ahead, behind, or right on track, the chart keeps everyone in sync.
If you're managing test cycles in Jira, AIO Tests can make this process much easier. AIO Tests is an AI-powered testing and test management tool that lets you create and track test case execution burndown charts without any manual setup. You get a clear visual of your testing progress right where you manage your work.
Book a demo for AIO Tests today and bring more clarity and control to your QA process.

FAQs
1. What are some common challenges or factors that might cause the actual burndown line to deviate from the ideal burndown line? How can teams effectively address these challenges to stay on track with testing progress?
Several factors can lead to deviations between the actual and ideal burndown lines in a QA Test Case Execution Burndown Report.
These factors may include unexpected changes in project scope, fluctuations in team capacity or productivity, unanticipated technical challenges, or dependencies on external resources.
To address such challenges, teams should prioritize effective communication, regularly update the burndown chart with real-time data, adapt testing strategies based on emerging issues, and collaborate proactively to mitigate any obstacles impacting testing progress.
2. Besides monitoring the rate of test case execution, what other key insights can be gleaned from analyzing the QA Test Case Execution Burndown Report? How can these insights be utilized to improve testing efficiency and ensure project success?
Beyond monitoring the rate of test case execution, the QA Test Case Execution Burndown Report provides valuable insights into the overall health and progress of the testing phase.
By analyzing trends and patterns in the burndown chart, stakeholders can identify potential bottlenecks, anticipate resource requirements, and assess the impact of any changes to the project timeline or scope.
These insights enable informed decision-making, allowing teams to allocate resources efficiently, adjust testing priorities as needed, and maintain alignment with project objectives.
Ultimately, leveraging the information gleaned from the burndown report facilitates proactive risk management and enhances the likelihood of delivering a high-quality product within the designated timeframe.


