


Summarize Blog
Quick Summary
Tracking the right test management metrics helps QA leaders uncover release risks, improve coverage, monitor defects, prioritize testing efforts, and make confident decisions that protect software quality before production deployments.
Every software release comes with thousands of testing signals, from executed test cases and defect reports to automation results and coverage data. Yet, despite having access to more information than ever before, many QA leaders still face the same challenge:
"Are we truly ready to release?"
Modern software delivery cycles have become faster and more complex. Agile development, CI/CD pipelines, and test automation help teams ship updates frequently, but they also create a constant stream of testing data that can be difficult to interpret.
The challenge is not collecting more metrics; it is identifying the insights that reveal real release risks.
A high pass rate does not always mean a stable release. A completed test cycle does not always mean complete coverage. QA leaders need the right test management metrics to evaluate quality, uncover gaps, and make confident release decisions backed by data, not assumptions.
Why Test Management Metrics Matter More Than Ever
Traditional QA reporting was built for a time when software releases followed longer development cycles. Teams would complete testing, compile reports, review open defects, and then decide whether the application was ready for deployment.
Today's development process looks very different.
With Agile methodologies, CI/CD pipelines, automated testing, and frequent releases, testing happens continuously throughout the software lifecycle. Waiting until the end of a release cycle to review reports is no longer practical.
Today's QA leaders need real-time visibility into testing progress, defect trends, and release risks so they can make informed decisions before software reaches production.
Traditional QA Reporting Is No Longer Enough
A traditional QA report typically includes:
- Total test cases
- Tests executed
- Tests passed
- Tests failed
- Open defects
- Closed defects
These are useful, but they provide limited context.
Activity Metrics vs. Decision-Making Metrics
Activity metrics describe how much work a team completed.
Examples include:
- Number of test cases created
- Number of tests executed
- Number of defects reported
- Hours spent testing
- Number of automated scripts
Decision-making metrics explain whether the release is becoming more stable or introducing additional risks.
Examples include:
- Coverage of critical requirements
- Open defects by severity
- Defect leakage
- Blocked test percentage
- Regression effectiveness
- Production defect trends
Activity metrics can help with workload planning. Decision-making metrics help QA leaders determine whether additional testing, defect resolution, or release postponement is necessary.
QA Metrics and the Release Decisions They Support
Common Mistakes QA Leaders Make
QA teams often create dashboards that contain every metric available in their testing tools. This makes reports appear comprehensive, but it can also hide the insights that matter most.
Other common mistakes include:
- Treating every test case as equally important
- Using pass rate as the main sign of quality
- Reporting raw defect counts without severity or business impact
- Reviewing individual numbers without comparing trends
- Separating requirements, tests, defects, and automation data
- Building reports manually in spreadsheets
- Measuring tester output instead of release risk
The purpose of QA reporting should not be to prove that the team is busy. It should help stakeholders understand product quality and make informed release decisions.
How Better Metrics Improve Release Quality
Well-selected metrics allow QA leaders to:
- Identify untested requirements early
- Detect delays in test execution
- Find modules with repeated failures
- Prioritize critical defects
- Evaluate whether automation results are trustworthy
- Understand how many issues escape into production
- Compare quality across releases
- Communicate risks clearly to leadership
Metrics deliver the most value when they're reviewed together. Coverage, pass rate, defect severity, and regression results provide a more complete release picture than any single number.
Testing Metrics in Software Testing That Every QA Leader Should Prioritize
The most valuable software testing metrics help answer one question: “Is this release ready? Instead of tracking dozens of disconnected numbers, QA leaders should focus on a few metrics that provide a clear view of quality, risk, and deployment confidence.
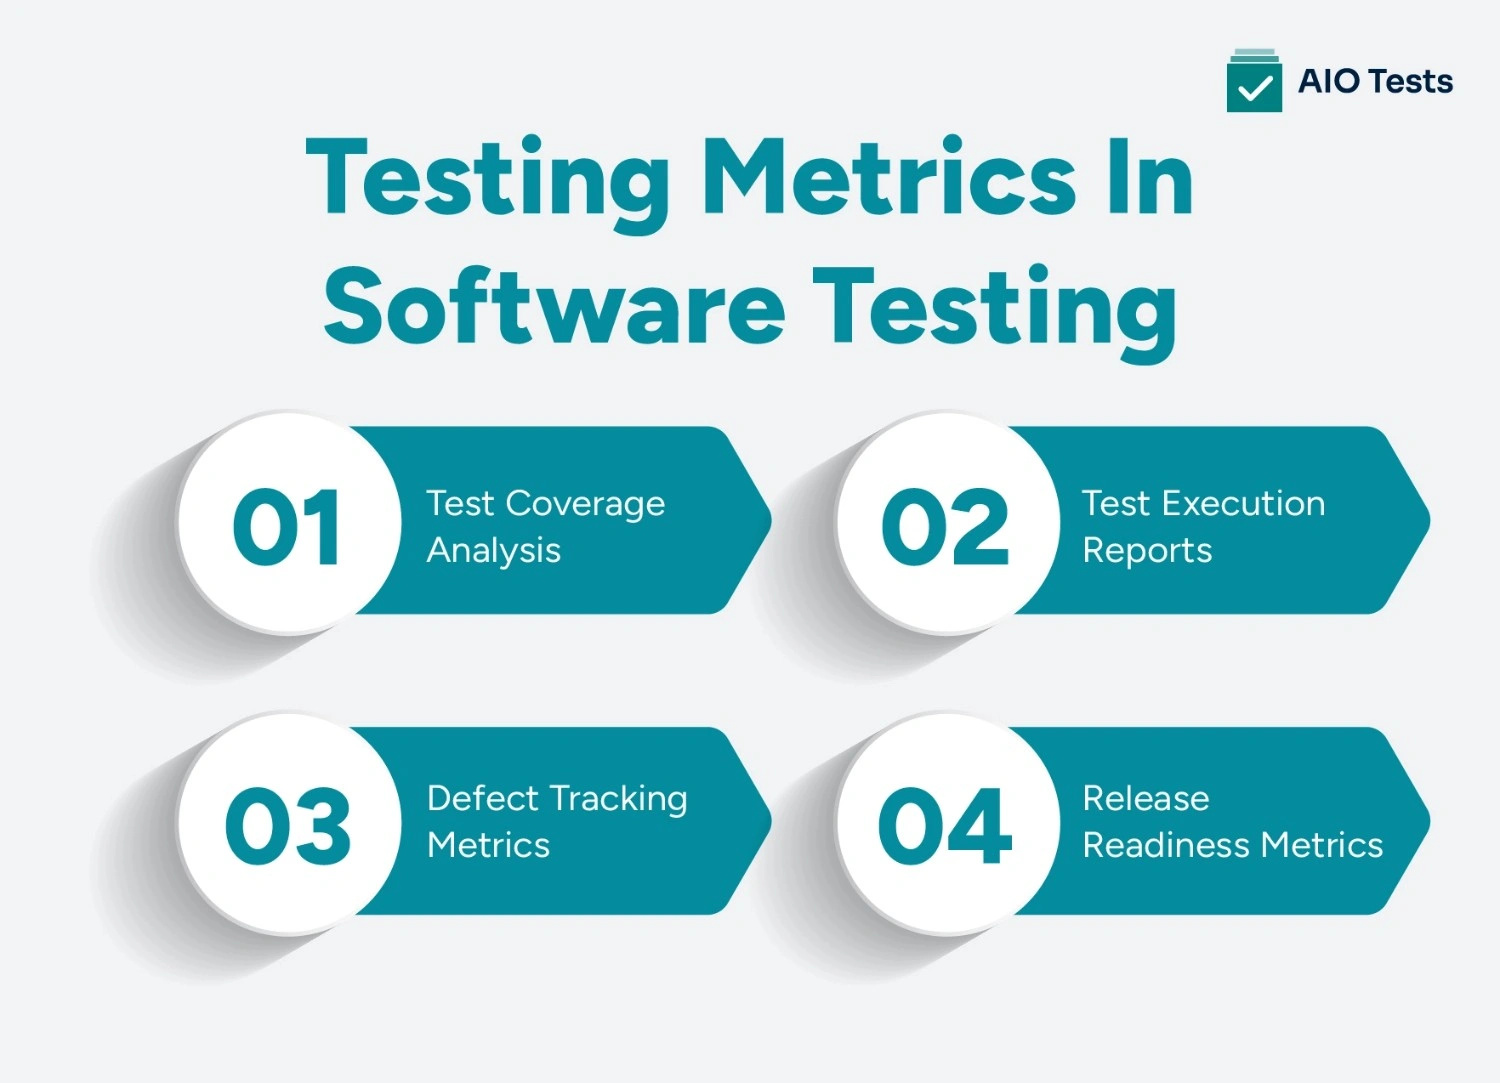
1. Test Coverage Analysis
Test coverage analysis shows how much of the planned release has been validated through testing. It should go beyond counting test cases and include requirement validation, feature coverage, and risk-based analysis. High-risk areas such as payment workflows, authentication, or critical business functions should always receive the highest level of testing.
Low coverage often indicates missing test cases, incomplete requirements, or weak traceability. Rather than reporting one overall percentage, monitor coverage by business priority to identify areas that need additional testing before release.
Example: A QA manager preparing an e-commerce release sees 90% overall requirement coverage, but only 65% coverage for the updated checkout workflow. Instead of relying on the overall percentage, the team prioritizes the untested payment scenarios before approving the release.
2. Test Execution Reports
Test execution reports help teams understand whether testing is progressing as planned. Key indicators include execution progress, pass rate, fail rate, blocked tests, and execution trends.
A high pass rate alone does not guarantee release quality. If critical workflows remain untested or blocked, the release may still carry significant risk. Always evaluate execution results alongside coverage and defect severity.
Example: An engineering manager sees that 95% of planned tests have been executed, but several authentication tests remain blocked because of an unstable test environment. The team addresses the environment issue before treating execution progress as evidence that testing is complete.
3. Defect Tracking Metrics
Effective defect tracking metrics focus on release risk rather than defect volume.
Monitor
- Defect density
- Defect leakage
- Defect reopen rate
- Defect aging and
- Open defects by severity
to understand where quality issues exist and whether fixes are reliable. A few unresolved critical defects can be more important than dozens of low-priority issues.
Example: A QA lead sees only eight unresolved defects before release. However, two affect login and payment workflows. The team prioritizes severity and business impact rather than using the total defect count as the release signal.
4. Release Readiness Metrics
No single metric can determine whether a release is ready. QA teams should evaluate test coverage, execution progress, critical defects, regression results, automation health, and performance testing metrics to identify risks and make confident release decisions.
These metrics provide visibility into application stability, scalability, and issues that could affect users after deployment. By reviewing multiple quality indicators together, QA leaders can make better release decisions based on real testing insights.
Test Metrics That Reveal the True Health of Your QA Process
Not all test metrics measure the success of a single release. Some reveal how effective, reliable, and mature the overall QA process has become. These metrics help QA leaders identify process gaps before they impact future releases.
Test Case Effectiveness
Test case effectiveness measures how well your test cases identify defects.
A low score often points to weak test design, outdated test cases, or poor risk coverage. Instead of writing more test cases, teams should focus on improving the quality and relevance of existing ones.
Defect Detection Effectiveness
This metric measures how many defects are found before software reaches production.
A high value indicates that the testing process is detecting a larger share of defects before they reach users. Tracking this metric by defect severity provides even deeper insights.
Requirement Traceability
Requirement traceability connects requirements with test cases, executions, and defects. It helps QA leaders verify complete test coverage, assess the impact of changes, and maintain compliance during audits and release reviews.
Regression Effectiveness
Regression effectiveness evaluates whether regression testing catches issues introduced by recent code changes. Review escaped regression defects, critical workflow coverage, execution time, and automation stability to ensure the regression suite continues to deliver value.
Test Environment Stability
Even a well-designed test strategy can fail if the environment is unstable. Frequent downtime, missing test data, unavailable services, or infrastructure failures can delay testing and reduce confidence in results.
Software Quality Metrics That Leadership Actually Cares About
While QA teams track detailed testing data, leadership is more focused on understanding business impact. The most valuable metrics for software quality help answer whether releases are becoming more stable, customer experience is improving, and quality risks are decreasing over time.
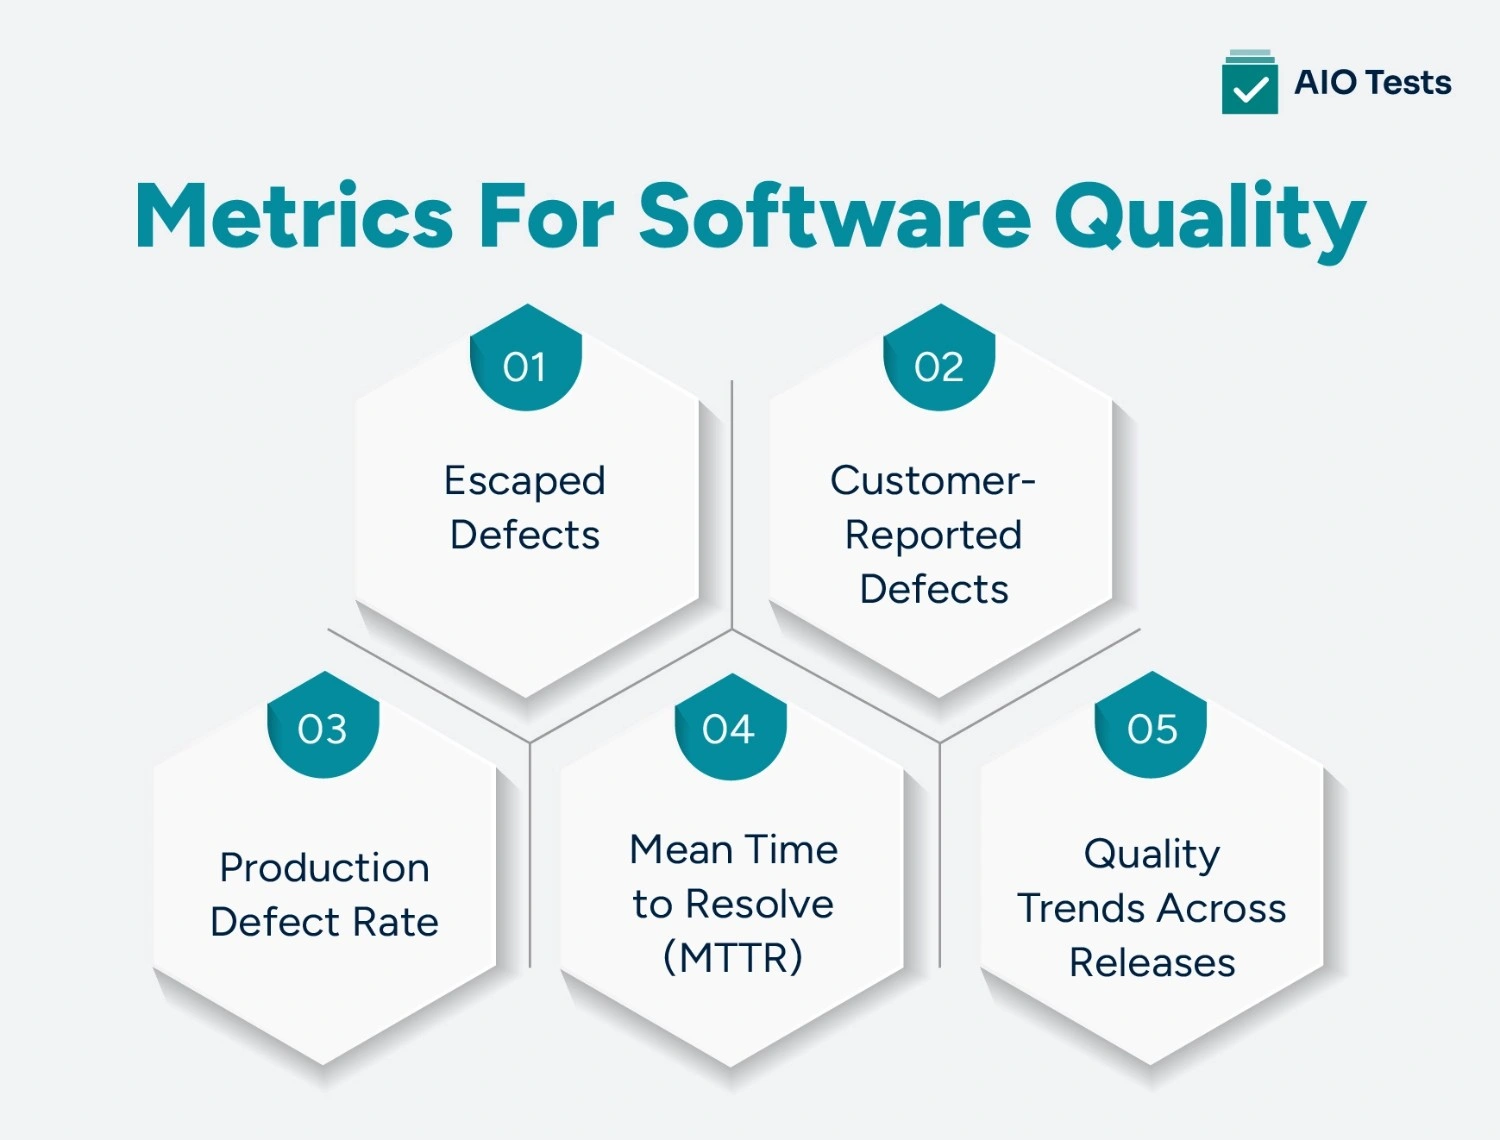
- Escaped Defects: Tracks defects discovered after release. Review them by severity, affected feature, customer impact, and root cause to identify gaps in the testing process.
- Customer-Reported Defects: Measures issues reported directly by users. These defects often reveal real-world scenarios, device combinations, or workflows that internal testing may have missed.
- Production Defect Rate: Monitors defects found after deployment. Compare trends across releases, features, and severity levels instead of relying on a single release snapshot.
- Mean Time to Resolve (MTTR): Shows how quickly critical production issues are resolved. A longer resolution time may indicate ownership gaps, inefficient processes, or limited production visibility.
- Quality Trends Across Releases: Evaluate long-term changes in software quality by monitoring:
- Escaped defects
- Critical production incidents
- Rollbacks and hotfixes
- Defect reopen rate
- Regression failures
- Release delays caused by quality issues
- Coverage of critical business workflows
These metrics help leadership measure the effectiveness of QA efforts and determine whether software quality is improving with every release.
These software quality metrics help leadership understand whether investments in QA, automation, test management, and engineering practices are producing measurable results.
QA KPIs Every QA Leader Should Review Before Every Release
Not every metric needs to be reviewed with the same regularity. Some QA KPIs require daily attention during active testing, while others are more useful at the sprint, release, or monthly level.
These KPIs should not be reviewed separately.
For example:
- A high pass rate should be checked against test coverage.
- Automation coverage should be checked against the flaky test rate.
- Test execution completion should be checked against blocked tests.
- Defect leakage should be checked against critical-path coverage.
- Requirement traceability should be checked against actual test execution status.
A balanced dashboard helps QA leaders avoid making release decisions based on incomplete information.
How AIO Tests Helps QA Teams Turn Metrics Into Better Release Decisions
Tracking meaningful QA metrics becomes challenging when requirements, test cases, executions, defects, and automation results are spread across multiple tools.
AIO Tests, a quality test management tool for Jira, brings the entire testing lifecycle into Jira, giving QA teams a single source of truth for monitoring testing progress, coverage, and release readiness.
- Real-Time Reporting and Release Visibility
Instead of waiting for manually prepared reports, QA teams can access 20+ built-in reports and dashboards that provide visibility into the following:
- Test execution progress
- Pass and fail rates
- Traceability and coverage
- Automation coverage
- Defect impact and trends
- Release readiness
Reports can be scheduled for automatic delivery to stakeholders and exported in PDF or Excel formats. Teams can also add built-in report gadgets directly to Jira dashboards for on-demand access to testing insights.
- End-to-End Traceability
This test management tool connects Jira requirements with test cases, execution cycles, and defects, providing complete traceability across the testing lifecycle. QA leaders can quickly understand:
- Requirement coverage
- Test execution status
- Linked defects
- Impacted requirements
- Untested areas
This end-to-end visibility supports release planning, impact analysis, compliance, and audit readiness.
- Unified Manual and Automated Testing Metrics
It supports both manual and automated testing within the same workflow. Automated results from frameworks such as Playwright, Cypress, Robot Framework, Cucumber, JUnit, TestNG, and Katalon can be reported directly into Jira, giving QA leaders a consolidated view of release quality across all testing activities.
- Coverage and Defect Tracking
Built-in traceability and coverage reports help teams verify that critical requirements are fully tested before release. Project health reports make it easier to monitor defect impact across multiple cycles, identify recurring quality issues, and focus testing efforts on high-risk areas.
- Less Time on Reports, More Time on Quality
Because testing data stays connected throughout the QA lifecycle, teams spend less time compiling reports and more time analyzing risks. QA leaders can rely on real-time insights from a single platform to make faster, more confident release decisions.

Common Mistakes When Tracking Test Management Metrics
Tracking the wrong metrics can create a false sense of confidence and lead to poor release decisions. Avoid these common mistakes to ensure your metrics drive meaningful improvements.
- Measuring Too Many Metrics: A dashboard filled with dozens of KPIs makes it difficult to identify what truly matters. Focus on metrics that align with release goals, product risk, and business priorities.
- Relying Only on the Pass Rate: A high pass rate does not always mean the release is ready. Review it alongside test coverage, blocked tests, critical defects, and automation stability for a complete picture.
- Ignoring Trends: Individual numbers rarely tell the whole story. Compare metrics across sprints and releases to identify recurring quality issues and long-term improvements.
- Tracking Metrics in Silos: When requirements, test cases, executions, and defects are spread across different tools, it becomes difficult to understand the real impact of testing. Connected data provides more reliable insights.
- Using Manual Spreadsheets for Reporting: Manually combining data increases the risk of outdated reports, calculation errors, duplicate information, and limited traceability. Automated reporting is more accurate and saves valuable time.
What’s Next?
Successful releases aren't driven by the number of tests executed or the size of the dashboard. They are driven by the ability to understand what the testing data is actually revealing. The right test management metrics help QA leaders uncover risks earlier, prioritize testing more effectively, and make confident release decisions backed by real evidence instead of assumptions.
The challenge is that these insights are difficult to trust when requirements, test cases, executions, defects, and automation results are scattered across multiple tools. A connected test management platform helps bring these signals together.
AIO Tests brings your entire testing lifecycle into Jira, giving QA teams complete traceability, real-time reporting, and the visibility needed to monitor release readiness from a single platform. Instead of spending valuable time compiling reports, your team can focus on improving software quality, reducing release risk, and delivering reliable software with confidence.

FAQs
- What are the most important test management metrics every QA leader should track?
QA leaders should focus on metrics that provide clear visibility into test coverage, execution progress, defect trends, automation performance, and release readiness. Metrics such as requirement coverage, pass rates, defect leakage, blocked tests, and regression effectiveness help teams identify risks and make informed release decisions.
- How do test management metrics improve software release quality?
Test management metrics help QA teams understand the overall health of a release by highlighting quality risks, coverage gaps, and areas that need attention. By analyzing testing data consistently, teams can detect issues earlier, improve testing efficiency, and release software with greater confidence.
- Which QA KPIs should be reviewed before every software release?
Before every release, QA teams should review key KPIs such as test coverage, test execution progress, critical defects, defect leakage, automation coverage, traceability, and pass rates. These metrics provide a complete view of release quality and help teams decide whether the software is ready for deployment.
- What is the difference between activity metrics and decision-making metrics in QA?
Activity metrics measure the amount of testing work completed, such as the number of test cases created or executed and the number of defects reported. Decision-making metrics show what testing activity means for release risk by helping teams identify gaps and determine whether more testing is needed.
- How does AIO Tests help QA teams track test management metrics in Jira?
This Jira test management tool helps QA teams track important testing metrics by connecting test cases, executions, defects, automation results, and reporting within Jira. With built-in reports and dashboards, teams can monitor coverage, execution progress, traceability, and release readiness from a single Jira-native test management platform


.svg)

